System Observability
Aug 30, 2024
observability grafana prometheus loki

Intro
I’ve been quite interested in system observability for the last few years. I’ve played around with many different tools – NetData, Prometheus, Loki, Grafana and several more.
A few months ago, I was scrolling through my RSS feed and saw an article announcing Grafana’s new project called Alloy – It’s the successor to the Grafana Agent.
 I’d known about Grafana Agent for a while, but I never bothered trying it, I figured that now was the perfect time to try Alloy.
This blog post/ramble will go over my preferred system observability setup.
Before I go into detail about what Grafana Alloy is, I want to give some background about the current monitoring setup for my servers.
Background
I’ve maintained a bunch of servers in different places – from Google Kubernetes Engine on GCP, k3s on bare-metal, to plain old VPS boxes on DigitalOcean.
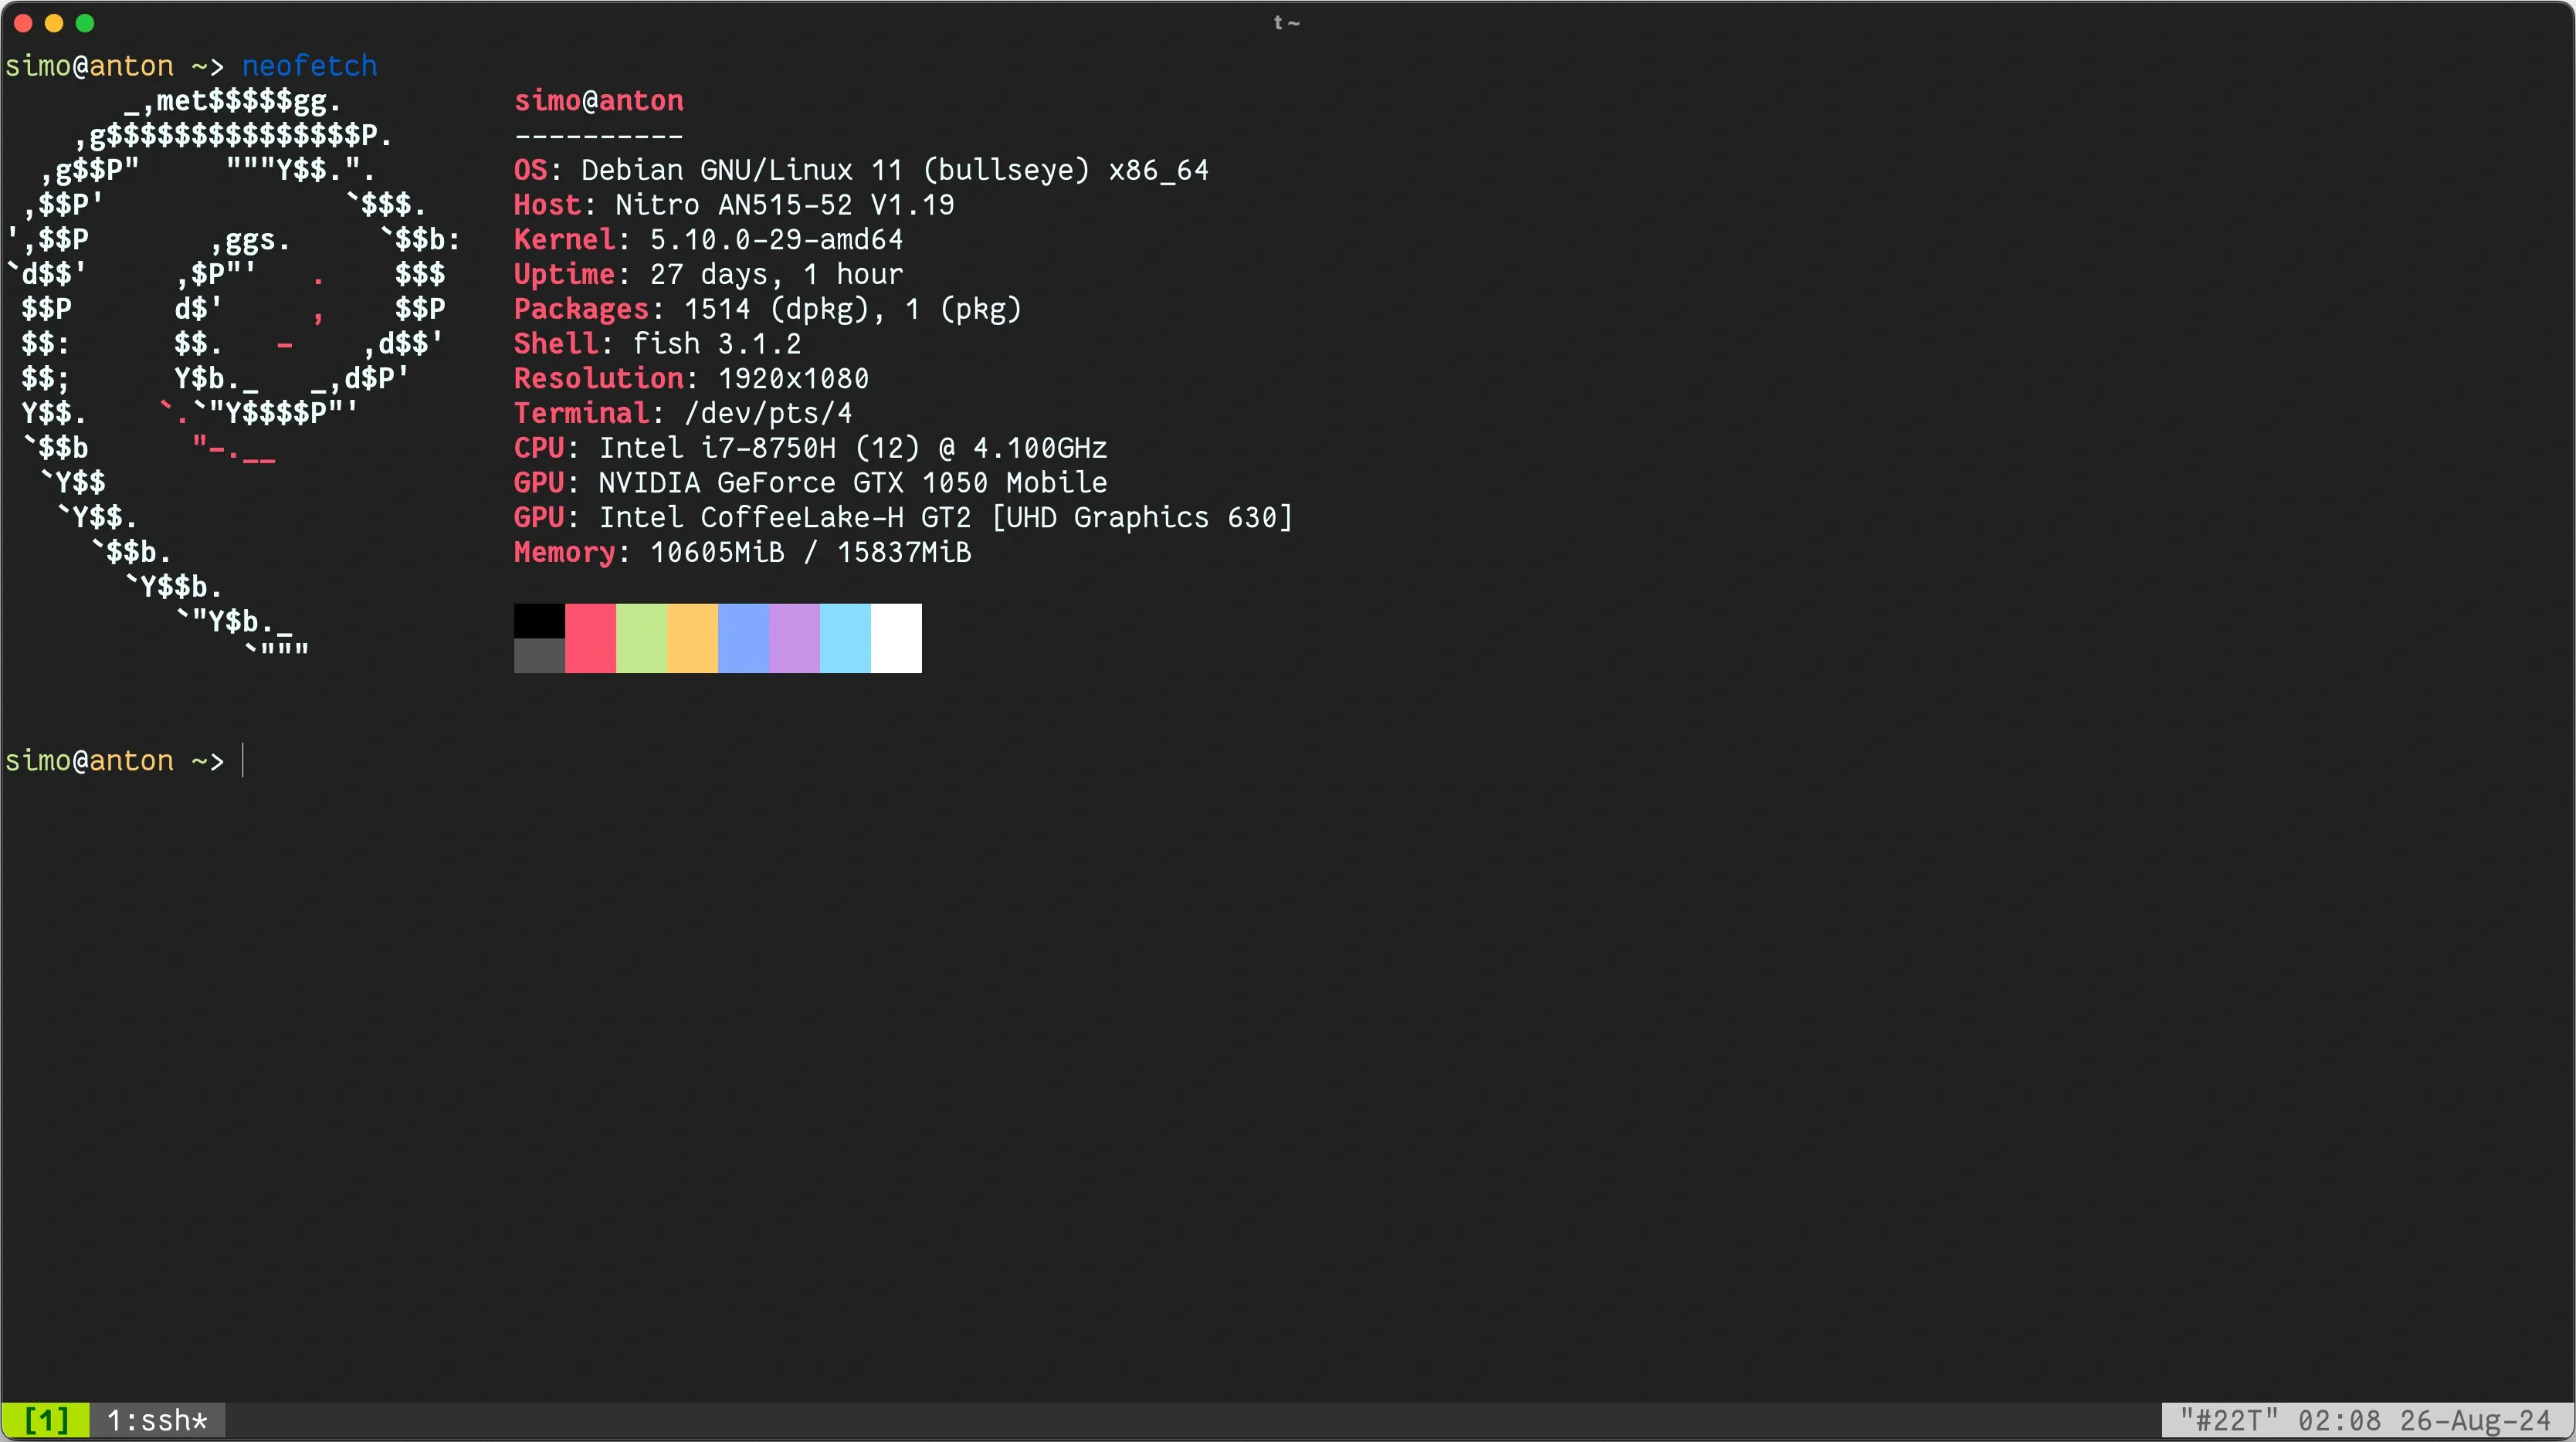
I’ll review my observability setup on my bare-metal home “cluster”. It’s not really a cluster right now as it has only one node, but I’ll eventually make a separate blog post talking more about it. In short, it’s an Acer Nitro laptop running Debian 11 with k3s installed.
One of the most common ways to monitor a Kubernetes cluster is using the kube-prometheus-stack Helm chart. It will deploy several components on your cluster (if you’re familiar with how this stack works, feel free to skip the next section as it’s a brief overview of it):
Prometheus
Prometheus is a time series database and a monitoring system that collects metrics from different applications/exporters.
 It uses a pull-based architecture where it will periodically scrape an endpoint on your services (typically called
 /metrics) and store the resulting measurements in its internal database.
If you have multiple nodes inside your cluster, you can have a single Prometheus instance with many targets, e.g. one node_exporter instance per node. Each exporter instance can assign different labels to its metrics, such that you can filter your data when building your dashboards/alerts.
 Exporters are separate services that you deploy that collect metrics and expose a Prometheus-compatible endpoint, such that Prometheus can scrape it. Some examples would be the official node_exporter, the postgres_exporter, and more.
Prometheus Operator
The Prometheus Operator is a project that deploys a Prometheus instance for you, while also giving you complete control over it using Custom Resources and tightly integrating with the Kubernetes API.
The operator utilizes service discovery to find targets to scrape automatically – this can be done using the ServiceMonitor custom resource:
apiVersion: monitoring.coreos.com/v1
kind: ServiceMonitor
metadata:
  name: api-backend-service-monitor
  labels:
    release: kube-prometheus-stack
spec:
  selector:
    matchLabels:
      app: api-backend
  endpoints:
    - targetPort: 8080
      path: /metrics
The operator will look for any ServiceMonitor resources in your cluster and build the necessary config updates in Prometheus. You can also define your Alertmanager rules using the PrometheusRule custom resource.
Grafana Mimir is a long-term storage engine for Prometheus metrics. Using Mimir allows you to “split” Prometheus’ storage from the collection/scraping process. This will come into play later when I talk about Grafana Cloud.
Thankfully, you don’t have to set all of this up manually as the kube-prometheus-stack helm chart mostly handles all of this for you.
Grafana
Grafana is a data visualization platform that allows you to build different dashboards based on a variety of data sources – Prometheus, Loki, PostgreSQL, etc.
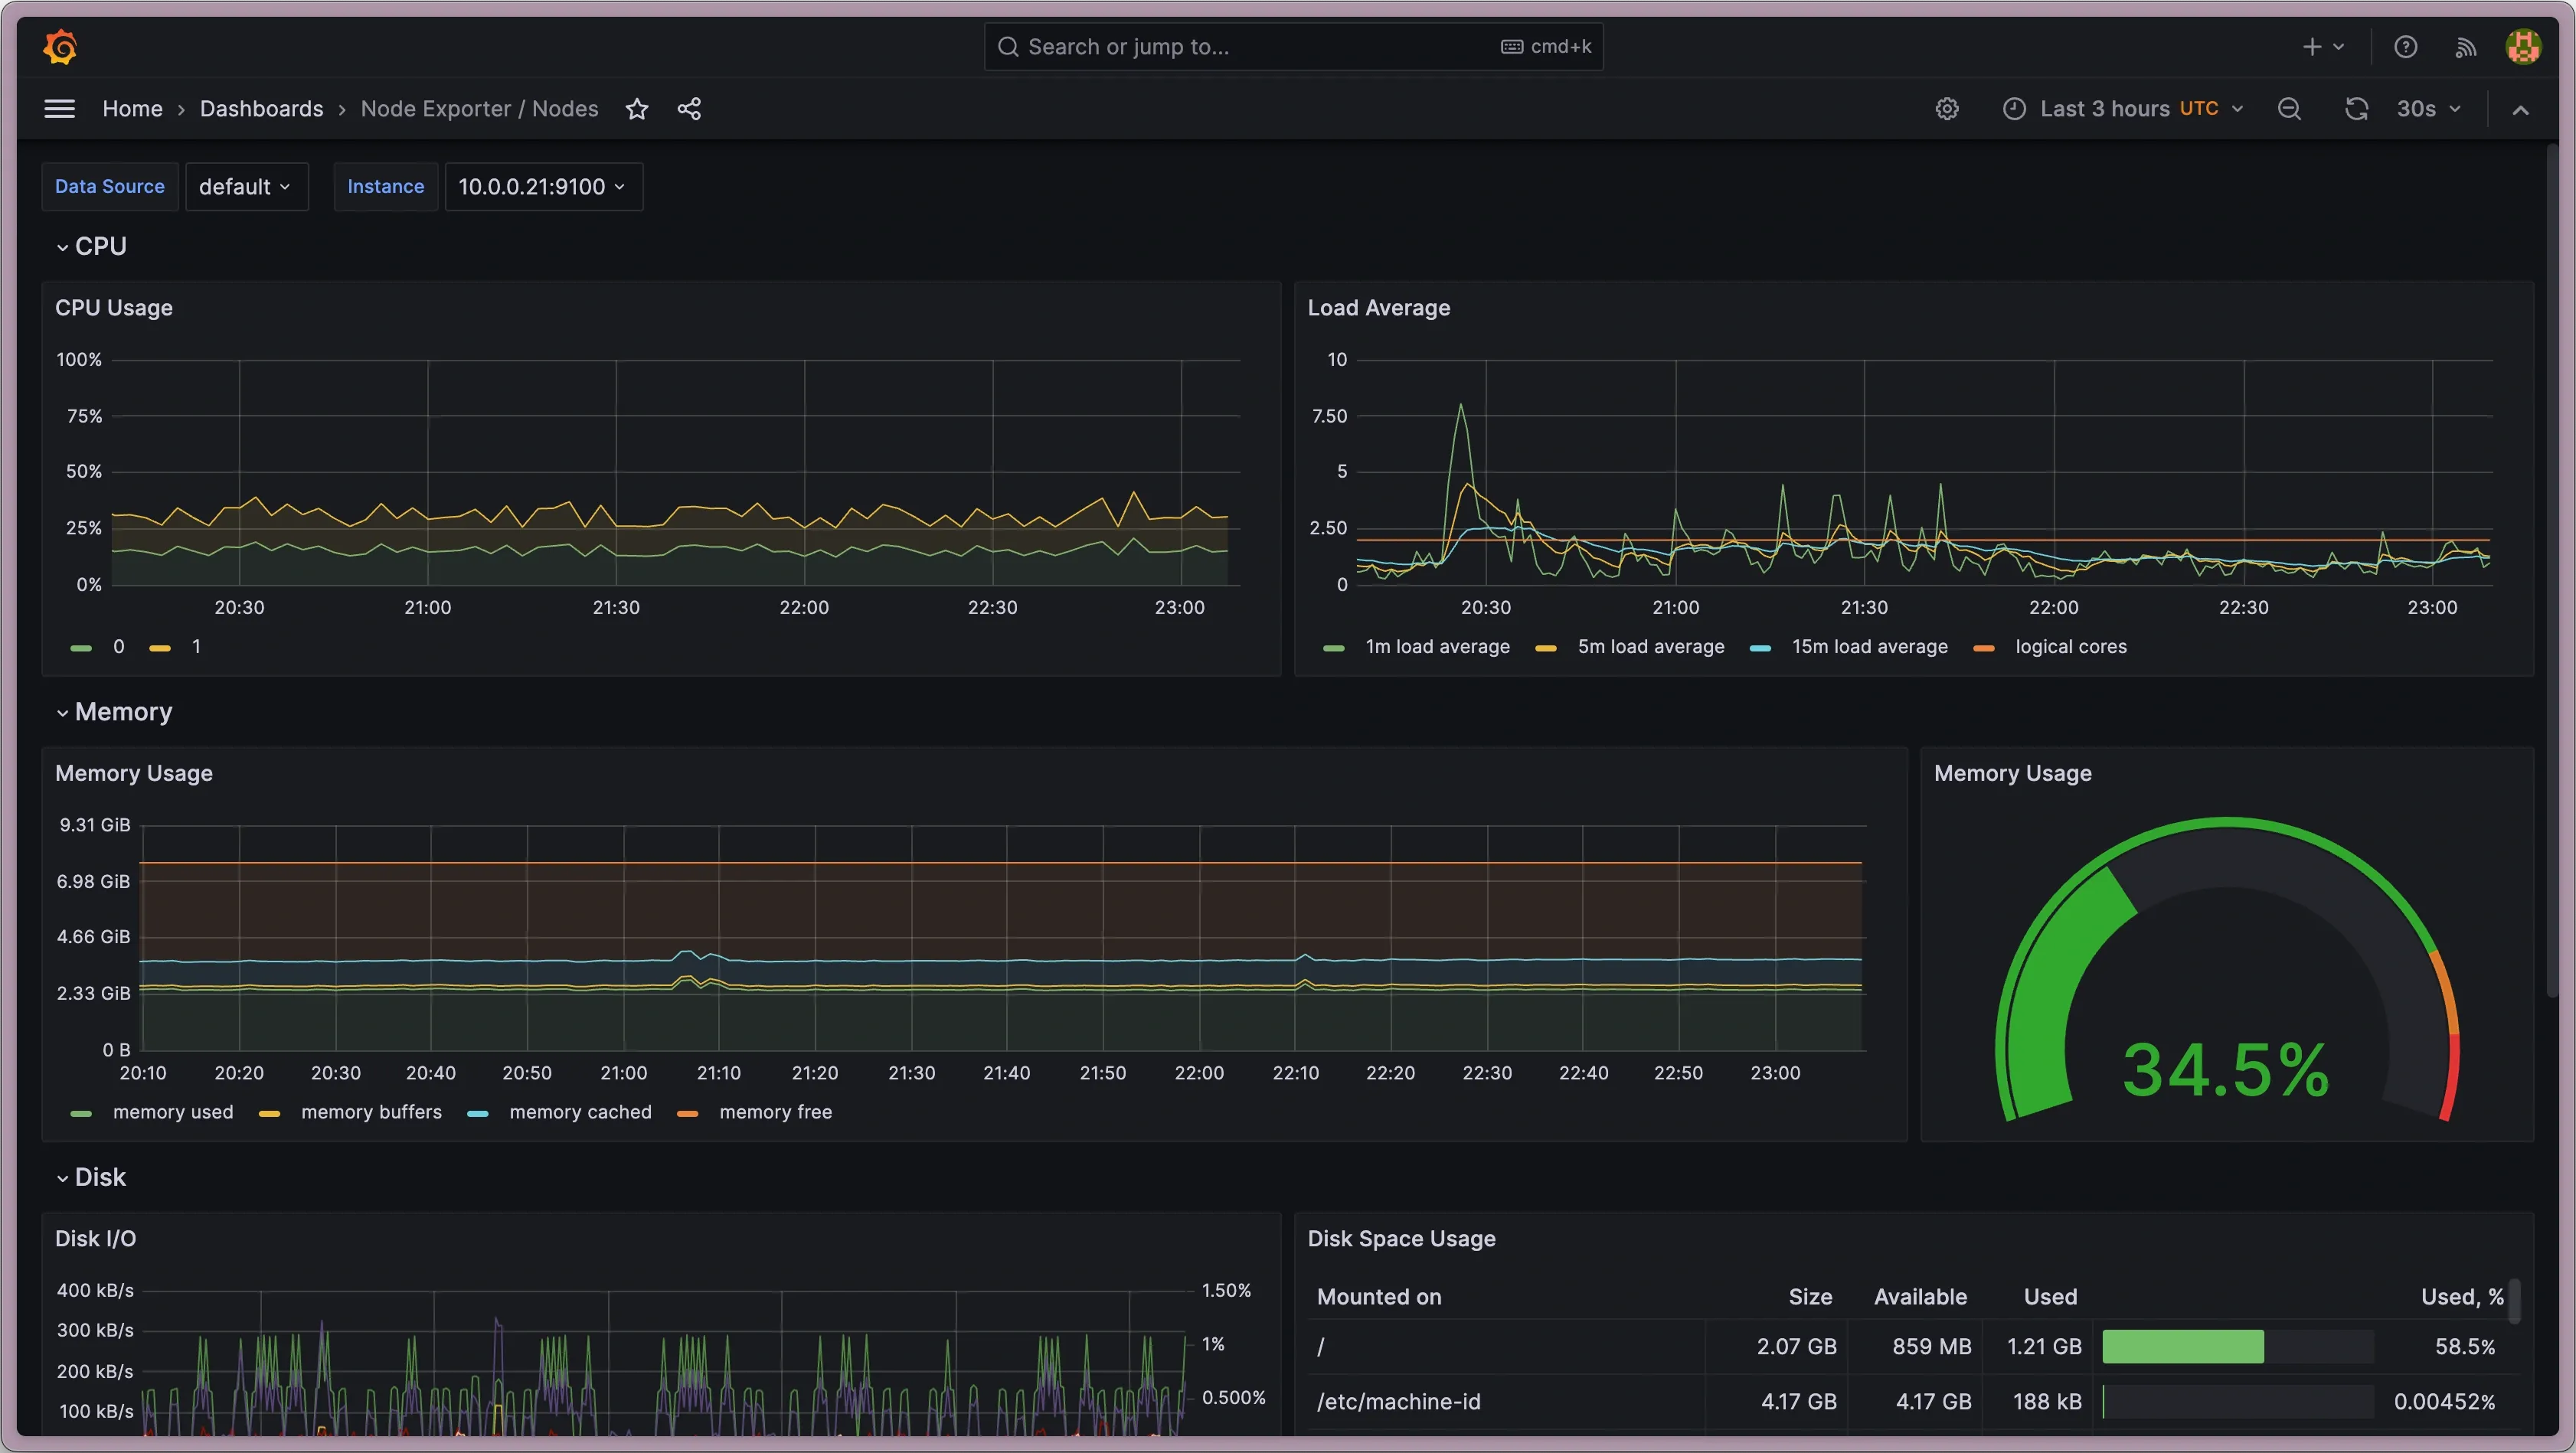 Here’s an example dashboard that displays Prometheus metrics about the Linux Kubernetes node using the aforementioned
 node_exporter.
Alertmanager
Alertmanager is pretty self-explanatory - you can build Prometheus alert rules that when triggered, will notify you via different receivers (e.g. Telegram / Slack / Discord). An example rule for detecting high request latency would be:
groups:
- name: HighLatencyAlerts
  rules:
  - alert: HighAverageRequestLatency
    expr: avg(rate(http_request_duration_seconds_sum{endpoint="/api/users"}[5m])) / avg(rate(http_request_duration_seconds_count{endpoint="/api/users"}[5m])) > 0.3
    for: 5m
    labels:
      severity: warning
    annotations:
      summary: "High average latency on /api/users endpoint"
      description: "Average request duration for /api/users endpoint is above 300ms for the last 5 minutes."
These alerts can be very crucial in a production environment where you want to know what’s happening in your system at all times.
Here is my (old) deployment of the kube-prometheus-stack.
Unfortunately, this only handles a third of the 3 pillars of observability. We’ll next introduce log aggregation to our system.
Loki
Loki is “Like Prometheus, but for logs.”. You can think of it as a database for your logs. Unlike Prometheus, it uses a Push-based architecture using its Promtail daemon.
 Similarly to the different exporters, this can be deployed across multiple nodes and labeled with the necessary metadata.
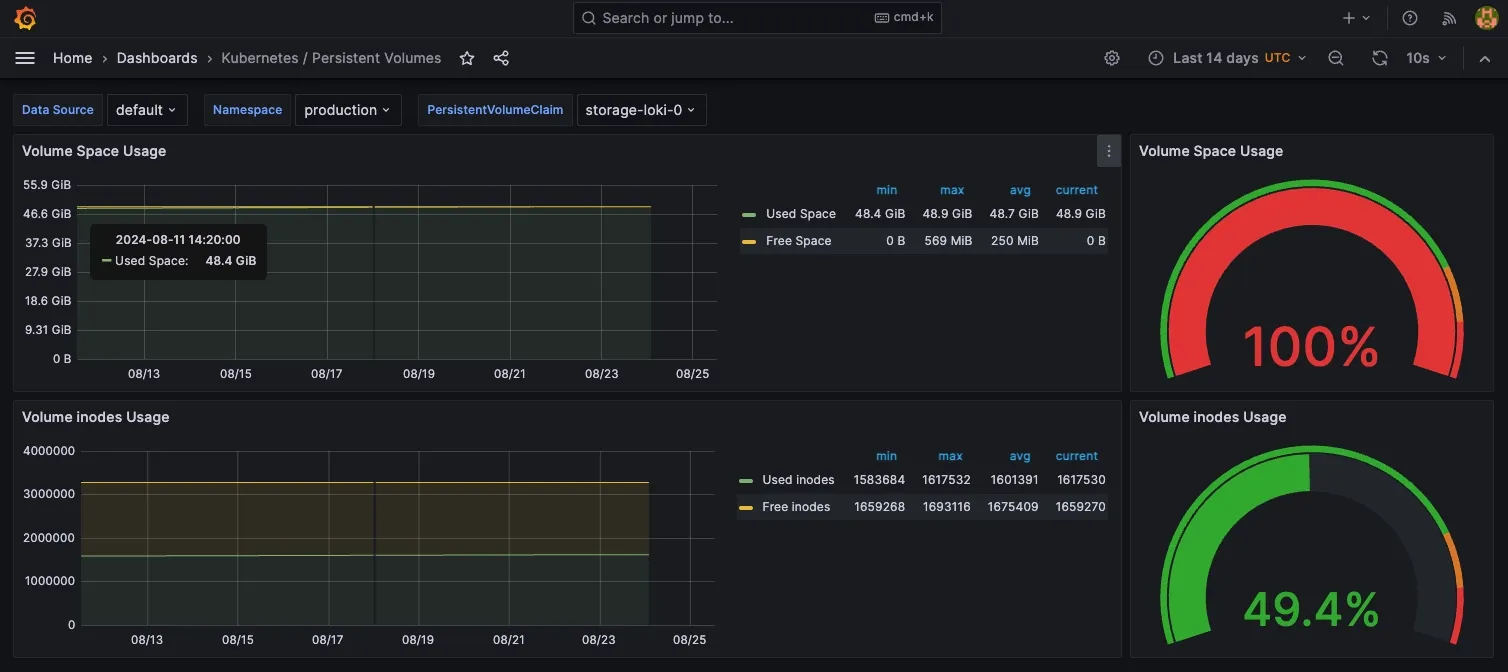
 Previously, I’ve deployed Loki using the loki-stack. It’s been mostly fine except for one problem I encountered in a different production cluster while writing this blog post.
Turns out my configuration for retention of 2 weeks hadn’t been working ever since I deployed it:
	# ...
    table_manager:
      retention_deletes_enabled: true
      retention_period: 336h # 2 weeks
    # ...
This meant that for the last 2 years, my Loki instance had been storing logs indefinitely, filling up my storage. In this cluster, I’d provisioned a 50GB SSD from GCP:
  persistence:
    enabled: true
    size: 50Gi
It took almost 2 years for me to notice:
This culminated in Loki being stuck in a CrashLoopBackOff, unable to start for the last several days.
If I had alerts configured for this, I would’ve found out much earlier, the irony :D
Other Solutions
I’m always looking for new tools to play around with or introduce/replace in my stack. One thing that I’ve been searching for is an all-in-one observability solution. I’d prefer if it was simple to set up, free, and flexible enough so that I can monitor anything while not being too heavy. Some contenders that I’ve been keeping an eye on include:
I haven’t had the time or opportunity to try them all, but will update this post with my experience with them if I ever do.
The announcement for Grafana Alloy made me want to experiment with it, as well as giving Grafana Cloud a chance.
Grafana Alloy does not require Grafana Cloud but I decided to use it as it helped me simplify my observability deployment. You can still benefit from Grafana Alloy even if you self-host the rest of your observability infrastructure.
Grafana Cloud
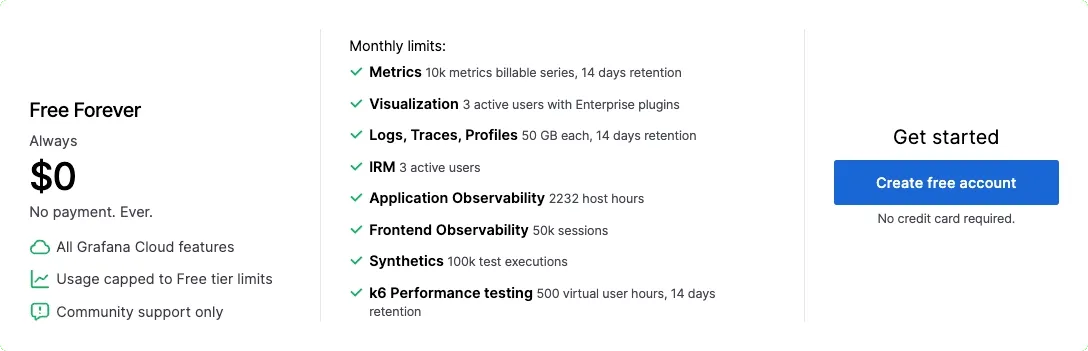
When I saw Grafana Cloud a while ago I thought to myself “Why would anyone want a cloud-managed Grafana instance? It’s pretty simple to self-host”. Turns out Grafana Cloud provides you with much more than just a Grafana instance – they give you a hosted version of Loki, Mimir, Alertmanager, k6 load testing, and more. Seeing that piqued my interest. Their free forever tier seemed more than enough for my use cases, I don’t even have my billing information filled in. This post is not affiliated with Grafana in any way, I just like the product.
Grafana Alloy
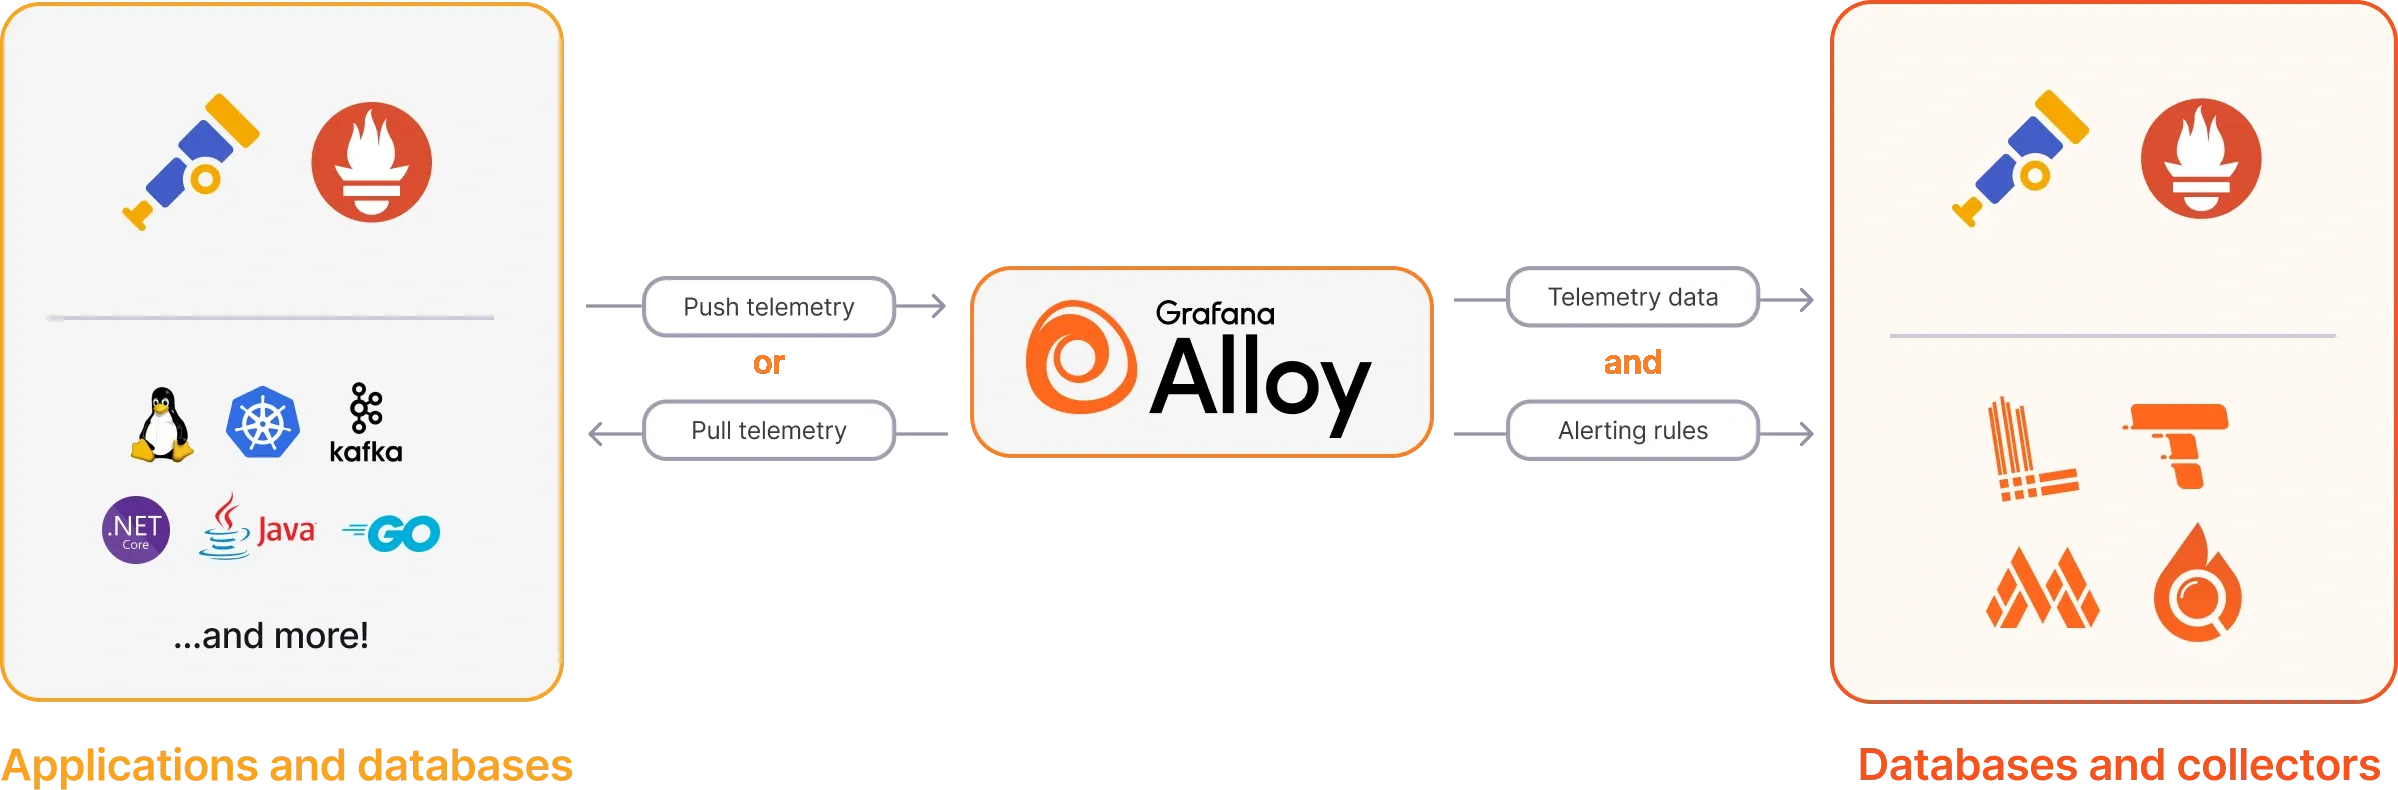
Grafana Alloy is an agent that runs on your servers – it’s an OpenTelemetry Collector1. Instead of having multiple different tools collect and store data, you can use as Alloy as a unified collector for everything.

It can act as a replacement for the scraper part of Prometheus, the agent part of Loki (Promtail), be a collector for traces, and more.
It does not store the actual data, however. It’s merely a “proxy” that collects your telemetry and pushes it to some remote storage, e.g. Mimir (or a Prometheus instance directly) for metrics, Loki for logs, Tempo for traces, etc. It does, however, have ephemeral storage for replaying the WAL in case of disruption.
This is where Grafana Cloud shined for me – I can get rid of the kube-prometheus-stack & loki-stack deployments, significantly reducing memory, storage, and maintenance overhead on my cluster(s).
Deployment
Alloy can be executed as a simple binary on your machine, as a system service, or be installed in a Kubernetes cluster using the official Helm charts.
There are 2 Helm charts that deploy Grafana Alloy. One is the bare-bones Alloy chart which only deploys Alloy by itself with 0 configuration and the opinionated k8s-monitoring chart. The latter deploys a few more services as well as builds the configuration for them out of the box.
Bare-bones Chart
At first I played around with the bare-bones one. This meant that I had to write the configuration by hand. After messing around with it for a few hours and seeing the appeal of the opinionated one, I scrapped my config. Regardless, here’s a quick overview of how it works.
The syntax for Grafana Alloy config files is inspired by HCL, If you’ve ever written Terraform code, you basically know it.
I was mainly interested in the official Grafana Cloud Kubernetes integration:
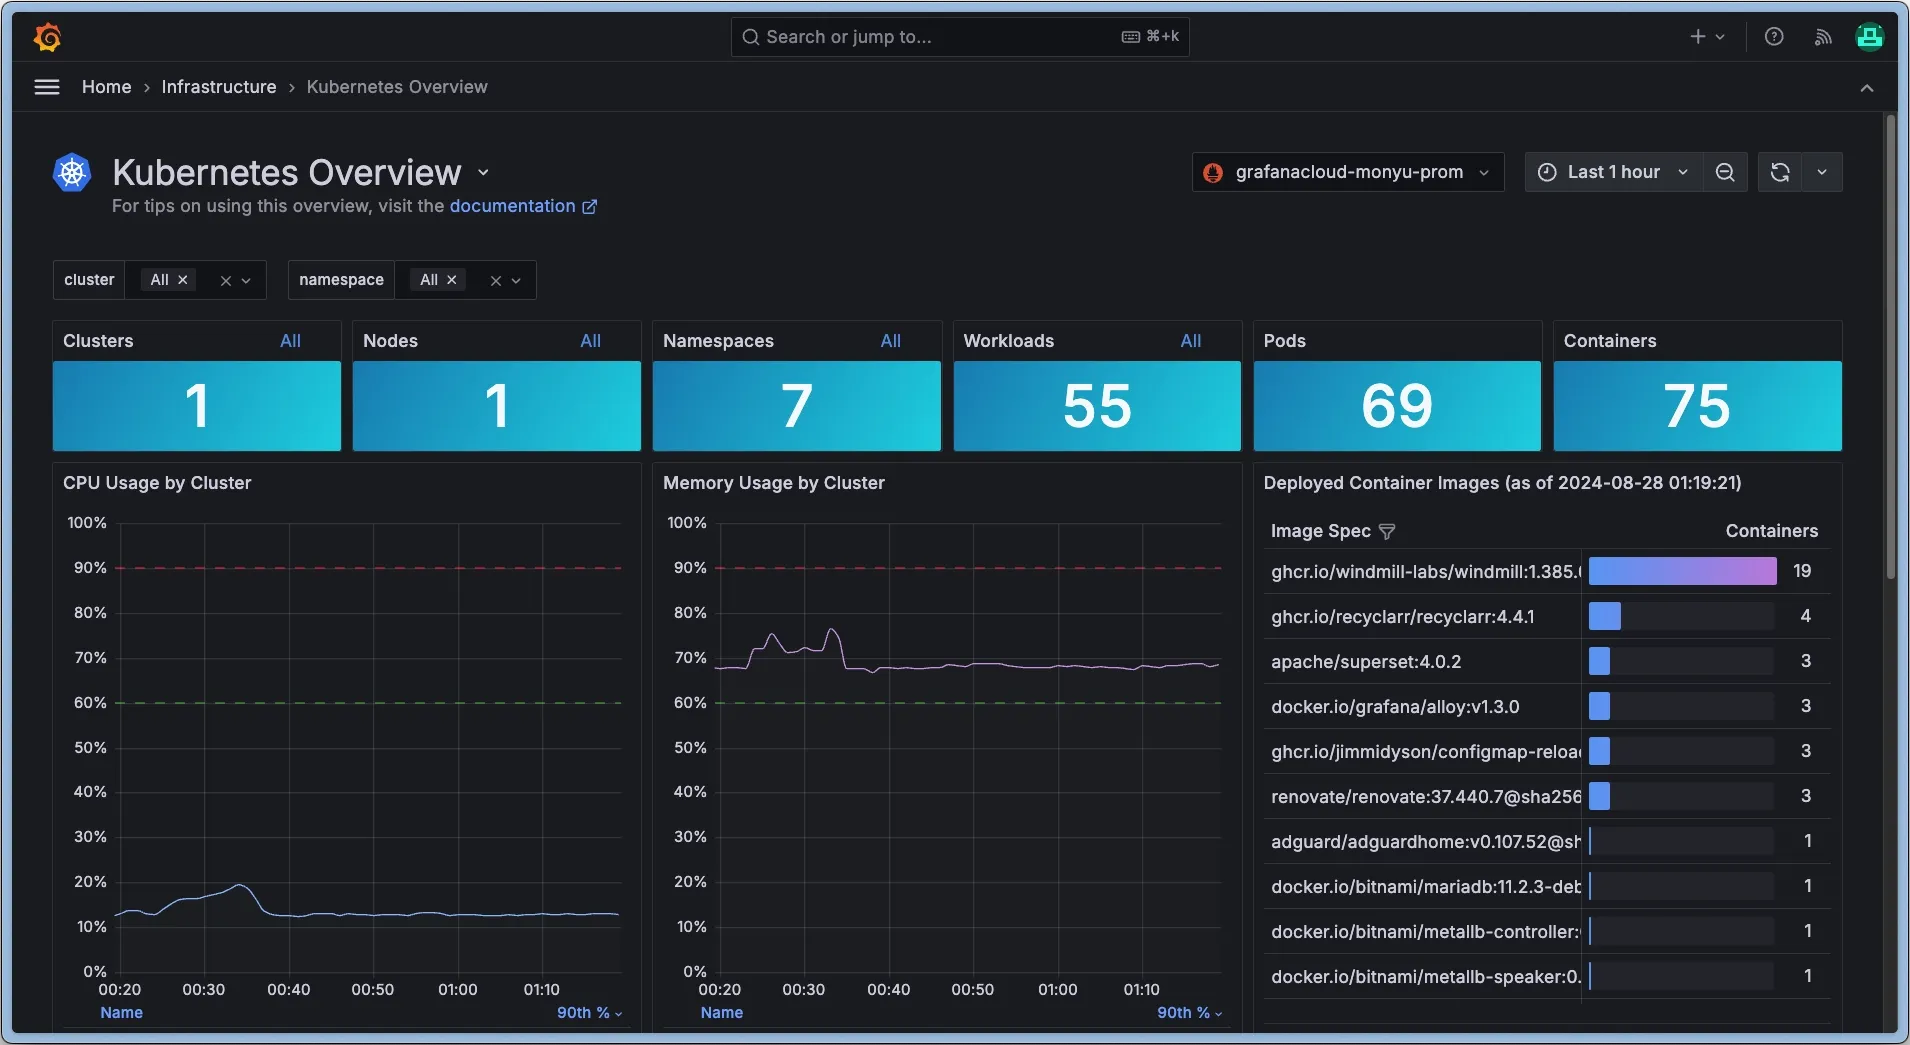 It comes with many different metrics, alerts, dashboards, etc. If you use Kubernetes, I highly recommend checking it out, I’ll definitely keep using it for future projects. Part of the features are powered by Prometheus metrics and the rest by logs. This meant that I had to configure Alloy to collect both, so I started with logging first.
Alloy has 4 main components that do the following:
- Discover targets –
discovery.kubernetes,discovery.ec2,local.file_match - Collect data from targets –
prometheus.scrape,loki.source.kubernetes - Transform data –
prometheus.relabel,loki.relabel,loki.process - Write to a receiver –
loki.write,prometheus.remote_write
// 1. Discover targets e.g. all Pods in your Kubernetes cluster
discovery.kubernetes "pod" {
  role = "pod"
}

// 2. Collect logs from our targets e.g. Pods in Kubernetes
loki.source.kubernetes "pod_logs" {
  targets    = discovery.relabel.pod_logs.output
  forward_to = [loki.process.pod_logs.receiver]
}

// 2. Collect logs from another source e.g Kubernetes Cluster Events
loki.source.kubernetes_events "cluster_events" {
  job_name   = "integrations/kubernetes/eventhandler"
  log_format = "logfmt"
  forward_to = [
    loki.process.kubernetes_logs.receiver,
  ]
}

// 3. Transform the log entries, e.g. adding static labels
loki.process "kubernetes_logs" {
  stage.static_labels {
      values = {
        cluster = "anton",
        region = "eu-east1"
      }
  }

  forward_to = [loki.write.grafana_cloud.receiver]
}

// 4. Write our logs to the remote Loki instance
loki.write "grafana_cloud" {
  endpoint {
    url = "https://logs-us-central1.grafana.net/loki/api/v1/push"
    basic_auth {
      username = "327384"
      password = "glc_eyJvI..."
    }
  }
}
Steps can reference each other’s output values or pipe the stream of data to a transformation or a write step using the forward_to directive. All of this can be visualized in the following graph2:

You can configure scraping Prometheus metrics in a similar way:
// 1. Discover Kubernetes Pods w/ custom selectors
discovery.kubernetes "pods" {
  role = "pod"

  selectors {
    role  = "pod"
    label = "environment in (production)"
  }
}

// 2. Collect metrics by scraping the Pods' metrics endpoints
prometheus.scrape "pods" {
  targets    = discovery.kubernetes.pods.targets
  forward_to = [prometheus.relabel.keep_backend_only.receiver]
}

// 3. Transform data
prometheus.relabel "keep_backend_only" {
  rule {
    action        = "keep"
    source_labels = ["app"]
    regex         = "backend"
  }

  rule {
    action = "labeldrop"
    regex  = "instance"
  }

  forward_to = [prometheus.remote_write.grafana_cloud.receiver]
}

// 4. Write data
prometheus.remote_write "grafana_cloud" {
  endpoint {
    url = "https://prometheus-prod-24-prod-eu-west-2.grafana.net/api/prom"
    basic_auth {
      username = "59482"
      password = "glc_eyJvI..."
    }
  }
}

k8s-monitoring Chart
2025/11/01 Update This post was written for the v1 version of the k8s-monitoring chart. v2 was released few days ago, which includes several breaking changes, a migration guide can be found here. The general concepts still apply, it’s just the overall Helm template structure that was changed.
The Grafana Cloud Kubernetes Integration requires data from the aforementioned log sources, as well as metrics from several agents. Other than Alloy itself, the k8s-monitoring chart also deploys:
- kube-state-metrics – provides metrics for Kuberentes itself, e.g. amount of Pods, Services, etc
- node_exporter – provides Linux-specific host metrics, e.g. CPU / Memory usage
- opencost – cost monitoring tool that I ended up disabling
- kepler – system power usage monitor that I also ended up disabling
The chart also configures Alloy to collect some extra stuff, e.g. cAdvisor metrics which are scraped from the Kubelet process on each node. You can definitely deploy all of these by yourself and build the necessary Alloy configuration blocks, but this chart does all of it for you. The bare-minimum chart config for me is this:
metrics:
    enabled: true
    node-exporter:
        enabled: true # enabled by default
    kube-state-metrics:
	    enabled: true # enabled by default
logs:
    enabled: true
    pod_logs:
        enabled: true # enabled by default
    cluster_events:
        enabled: true # enabled by default
prometheus-node-exporter:
    enabled: true # enabled by default
prometheus-operator-crds:
    enabled: true # enabled by default
kepler:
    enabled: false # I don't need kepler
opencost:
    enabled: false # I don't need opencost
Most of the config above can be removed, as the default Helm values are pretty good out of the box, I just like to be explicit. The only thing you’d have to set is your Grafana Cloud credentials (or whatever remote write service you want to use).
externalServices:
    prometheus:
        host: https://prometheus-prod-24-prod-eu-west-2.grafana.net
        basicAuth:
            username: "3245224"
            password: "..."
    loki:
        host: https://logs-prod-012.grafana.net
        basicAuth:
            username: "127038"
            password: "..."
After removing my kube-prometheus-stack and loki-stack deployments in favor of this, I saw a significant memory usage drop – Prometheus, Grafana, Loki, Promtail were taking up to ~2GB, meanwhile, the Alloy deployment itself takes up only 400MB. CPU usage also went down but I don’t have my old metrics – Alloy currently seems to be chilling at 0.02 CPU according to my metrics3.
On low-spec devices, such as the Raspberry Pi, this setup can free up some more room for your actual workloads.
Extra Integrations
If you want to introduce extra observability, e.g. metrics for a Postgres database, usually you’d have to deploy the postgres_exporter, make sure your Prometheus instance scrapes that, etc. Alloy, however, has many built-in exporters, including one for Postgres. This means that with just a few lines, you can have access to your metrics:
prometheus.exporter.postgres "production" {
  data_source_names = ["postgresql://b64:bWFpa2F0aQ==@localhost:5432/production?sslmode=disable"]
}

prometheus.scrape "postgres" {
  targets    = prometheus.exporter.postgres.production.targets
  forward_to = [prometheus.remote_write.grafana_cloud.receiver]
}
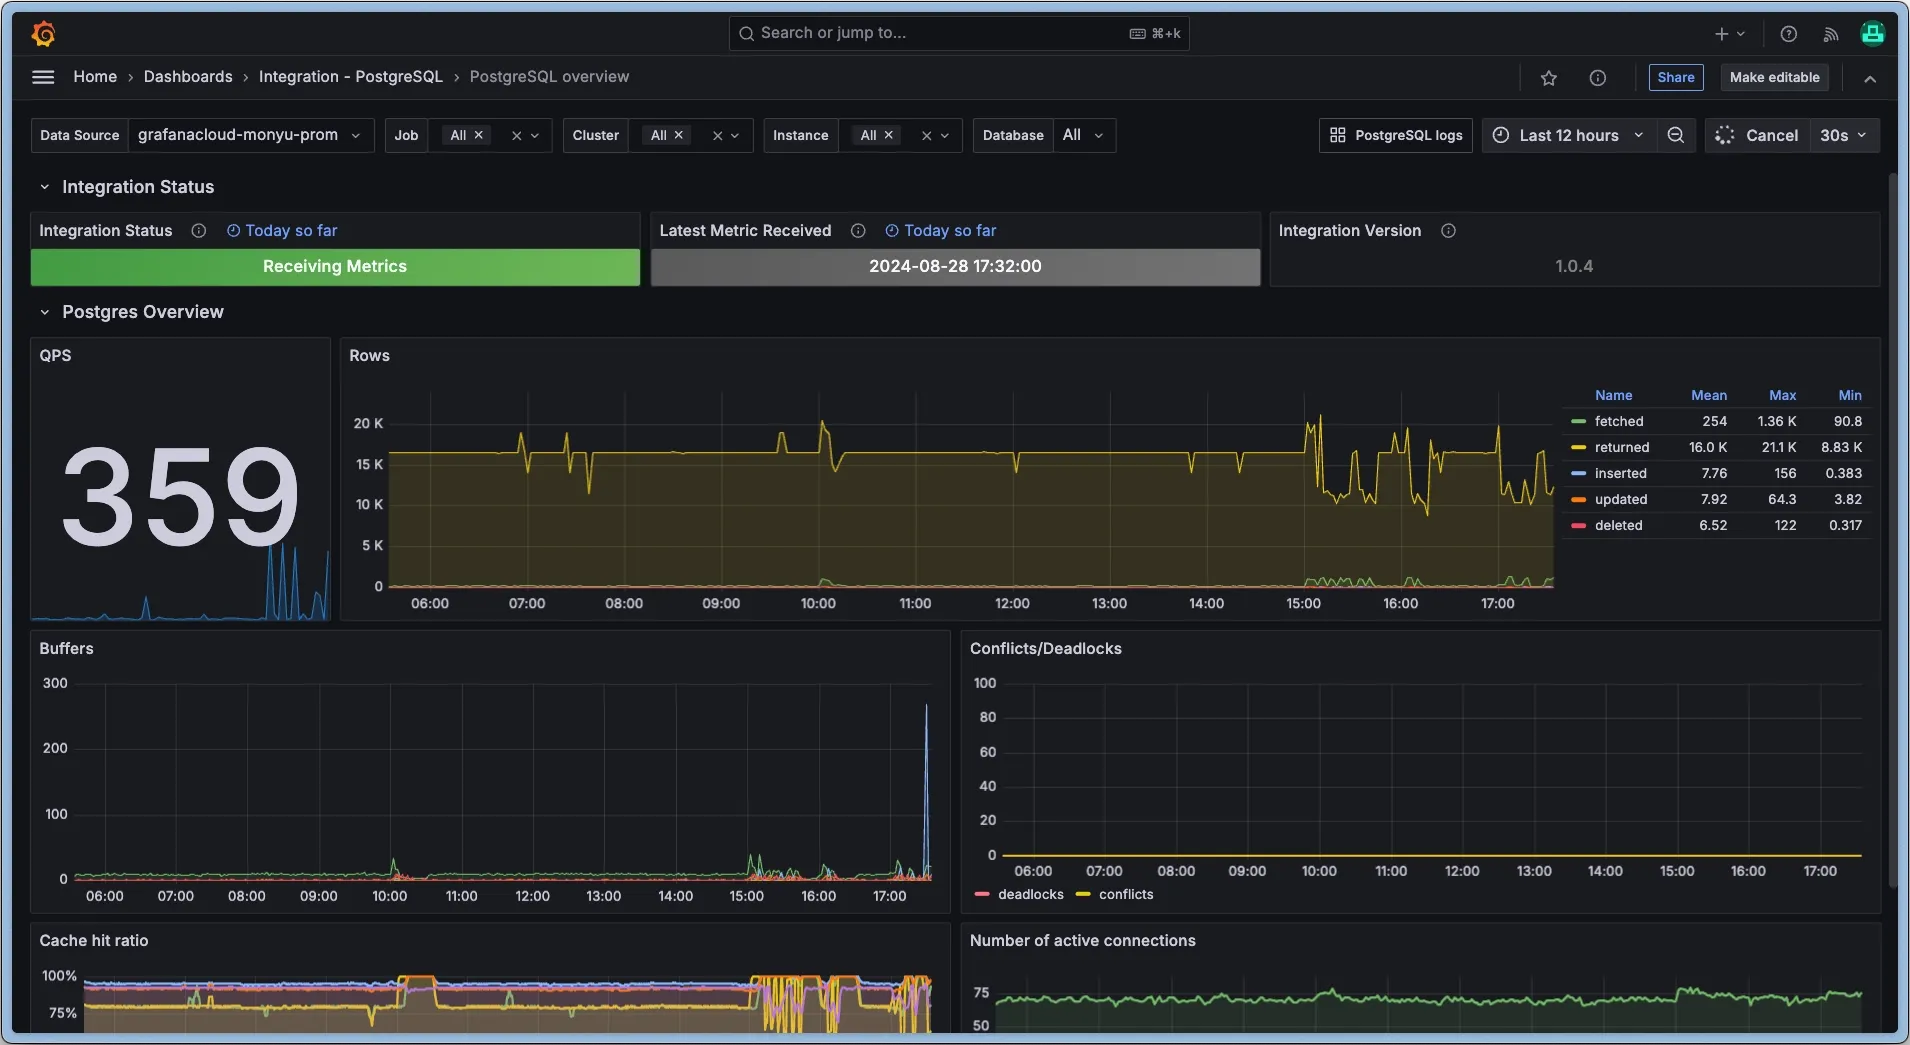
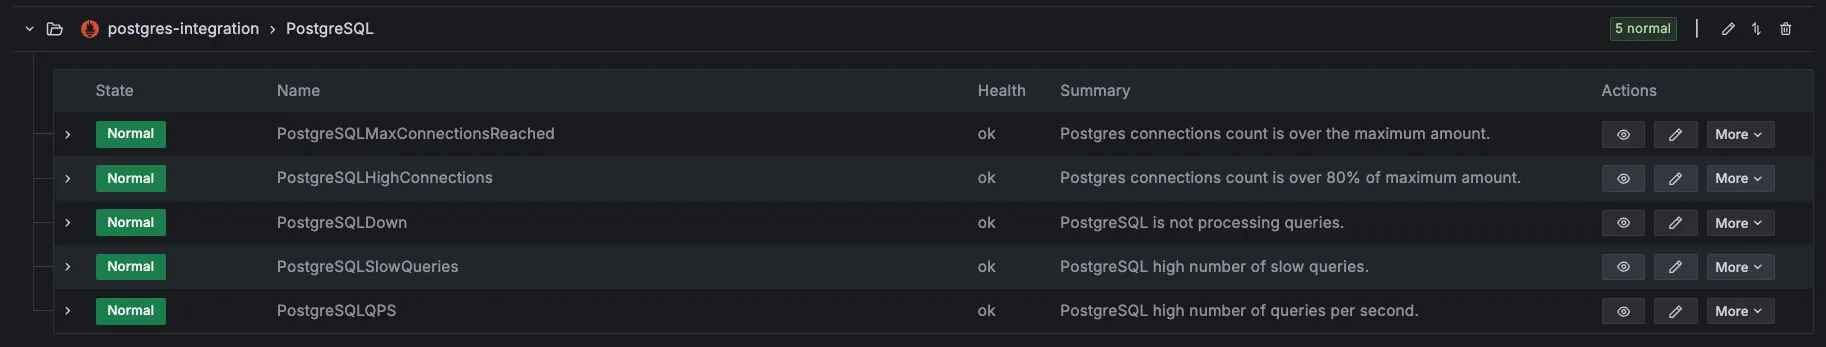
Combining this with the Grafana Postgres Integration, you can get a pretty dashboard w/ alerts in case you aren’t using a managed database service.
I repeated the same process for my MinIO deployment and added the respective integration, resulting in my final config here. Definitely explore the other dashboard & alert integrations in Grafana Cloud, especially the Linux Server one.
Further Reading
This blog post/ramble got kind of long, but there still are some interesting things I’d like to mention.
-
If you want to ensure high availability and/or are processing lots of data, Alloy can also be deployed in cluster mode. This will allow you to horizontally scale Alloy across multiple nodes.
-
If you have an existing Prometheus deployment and you want to stream data out of it to another instance (or Mimir), you can set up federation.
prometheus.scrape "federation" {
    targets = [{
        __address__ = "...",
    }]
    forward_to   = [prometheus.remote_write.grafana_cloud.receiver]
    job_name     = "federation"
    honor_labels = true
    params       = {
        "match[]" = ["{__name__=~\".+\"}"],
    }
    metrics_path = "/federate"
    scheme       = "http"

    authorization {
        type        = "Bearer"
        credentials = env("FEDERATION_CREDENTIALS")
    }
}
-
Consider different deployment methods based on your usage & infrastructure.
-
Alloy also performs monitoring on itself. You can add the Alloy Grafana Integration for alerts (or set them up yourself) if it goes down. This can be quite useful in order to know whether an actual service you monitor is down or if Alloy hasn’t been sending any metrics.
-
Alloy can also collect traces using their Zipkin, Jaeger or OTLP receivers and send them to Tempo. I haven’t played around much with traces before, but would love to soon. You can also collect profiling data and send it to Pyroscope.
-
Setting up alerting in Grafana Cloud was quite easy – I added my Telegram Bot as a contact point & notification policy and stuff worked right away.
Footnotes
-
OTEL is a framework/standard for managing metrics/logs/traces. ↩
-
Grafana Alloy also comes with a web interface for debugging which provides an entire graph of your blocks ↩
-
Your mileage may vary, memory and CPU usage are based on the amount of metrics and data you process. You can also definitely fine-tune the kube-prometheus-stack and loki-stack deployments, but I’m fine with offloading this to someone else (the “Cloud”). ↩